We will start with the Server using the automated installation script.
curl -L http://install.shinken-monitoring.org | /bin/bash
The install script will create the user and group. Install all dependencies and then process Shinken installation.
Once the installation is done, the shinken WebUI can be accessed using the
http://X.X.X.X:7767 and the credentials admin/admin. The configuration folder will be located in /usr/local/shinken/etc.Preconfiguring Shinken Server
Before diving in the configuration process of Shinken, we need to secure its WebUI.
Let's edit the module web UI:
nano /usr/local/shinken/etc/shinken-specific.cfg
We'll start by changing the
auth_secret, and replacing CHANGE_ME by strong password:define module {
modules Apache_passwd, ActiveDir_UI, Cfg_password, PNP_UI, Mongodb, Glances_UI
manage_acl 1
play_sound 0
host 0.0.0.0
module_type webui
allow_html_output 0
max_output_length 100
module_name WebUI
auth_secret CHANGE_ME
port 7767
}
Save and close the file.
Then our admin user should get a strong password too. For that we'll replace his default password by a secret strong one on the
contacts.cfg file :nano /usr/local/shinken/etc/contacts.cfg
define contact{
   use             generic-contact
   contact_name    admin
   email           shinken@localhost
   pager           0600000000   ; contact phone number
   password        admin
   is_admin        1
}
Even if the installer takes care of installing all the necessary dependencies and modules, we need to install mongodb support for handling and saving user preferences on the webui, or we will get an ugly warning message on the web UI saying:
Error : you didn't define a WebUI module for saving user preference like the Mongodb one. You won't be able to use this page!
To install Mongodb support:
cd /usr/local/shinken
./install -a mongodb
Configuring Shinken Server
For our scenario, we will start by declaring the Ubuntu 12.04 monitored host (Shinken slave), install and configure SNMP on it, and then monitor it using a custom community string.
The SNMP template will processes the following checks:
- host check each 5 minutes: check with a ping that the server is UP
- check disk spaces
- check load average
- check the CPU usage
- check physical memory and swap usage
- check network interface activities
Once it's done, we'll use FTP and SSH package to check FTP & SSH states on the slave as an example on how to use packages.
Packages are predefined monitoring templates for generic or specific services, appservers, operating systems and monitored-capable devices. These packages are located in the following directory
/usr/local/shinken/etc/packs categorized by type, and to use them we only need to specify their names on the host definition file.
Since Shinken is fully compatible and supports Nagios, Nagios plugins can be added and used through Shinken.
Define slave on Shinken
One the monitoring server, let's create a host file corresponding to our Linux device (Ubuntu slave droplet) on
/usr/local/shinken/etc/hosts directory:nano /usr/local/shinken/etc/hosts/shinken_slave.cfg
Copy and paste the following content and change the “host_name”, and “address” fields to appropriate values.
define host{
   use             linux
   host_name       Shinken_slave
   address         X.X.X.X
   _SNMPCOMMUNITY  DOmonitoring
}
- The "use linux" is the "template" line. It mean that this host will use properties from the default linux template.
- The “host_name” is the object name of your host. It corresponds to the hostname of our client and must be unique.
- The “address” is the IP address of the slave or its FQDN.
- The “_SNMPCOMMUNITY” is the custom SNMP community string or the password.
As we mentioned before, we're going to use two packages for monitoring FTP & SSH services. These packages will check the state of publicly available services, applications and protocols without any special access requirements. For that we're going to add them to the host definition file, on the line 'use' separated by a comma. We can use as much as we can, but we need to remember that we only need to monitor what is important.
The previous
/usr/local/shinken/etc/hosts/shinken_slave.cfg will look like this:define host{
use linux,ftp,ssh
host_name Shinken_slave
address X.X.X.X
_SNMPCOMMUNITY DOmonitoring
}
As we mentioned before, we are going to use a custom SNMP community string (password) for our client. For this guide, we chose “DOmonitoring” – it will be the same on the client.
Now that we declared our host, let's restart Shinken to process the changes:
service shinken restart
Configuring the client:
We’ll start by installing SNMP on our client.
apt-get install snmpd
Then we configure Community strings and listening interfaces.
Edit the
/etc/snmp/snmpd.conf and comment the line:agentAddress udp:127.0.0.1:161
Then, uncomment the line:
agentAddress udp:161,udp6:[::1]:161
As we already mentioned before, we are going to change the SNMP community (password) for our client by changing the default value “public” by a customised one. For the purpose of this tutorial, “DOmonitoring” will be chosen.
Replace :
rocommunity public
With:
rocommunity DOmonitoring
Restart the snmpd daemon:
service snmpd restart
Accessing the WebUI
For now, our monitoring server and client are configured. We need to access the Shinken Web UI using the IP address of our server
http://X.X.X.X:7767.
Once authenticated, we will see a blank page saying “You don't have any widget yet?”
We will configure it later with custom widgets to get the information needed, but first we need to check if our client is configured and reachable by the server.
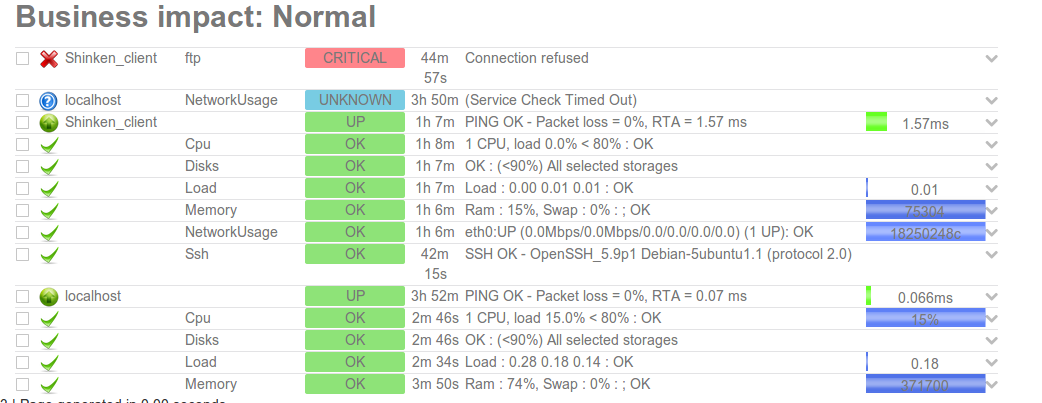
Click on All tab and you will see a list of all monitored machines, including the server(localhost).
On the same list you should find Shinken_slave like :

Let's go back the dashboard and create one by adding three widgets. Since we have only one monitored droplet, we will add graph, problems and relation widgets.
Click on
add a widget then choose the one you want from the panel. By default, the widgets will get the localhost (monitoring server) states and informations. We can edit them to reflects the host we want by clicking and specifying the “Element name” as shown:

Our monitoring server will keep an eye on our VPS and track of all the changes. The longer the server runs, the more interesting the graphs and stats will become.


